Halfway through 2022, we have seen turbulent markets around the world, especially the US economy, which has seen its 2022 rise in the face of decades of high inflation, Fed tightening, and the Russia-Ukraine war. In trouble for half a year.
In today's report, we will analyze the trend of the U.S. stock market and let investors know the big and small things about the analysis of the U.S. stock market.
Analysis of the historical trend of US stocks
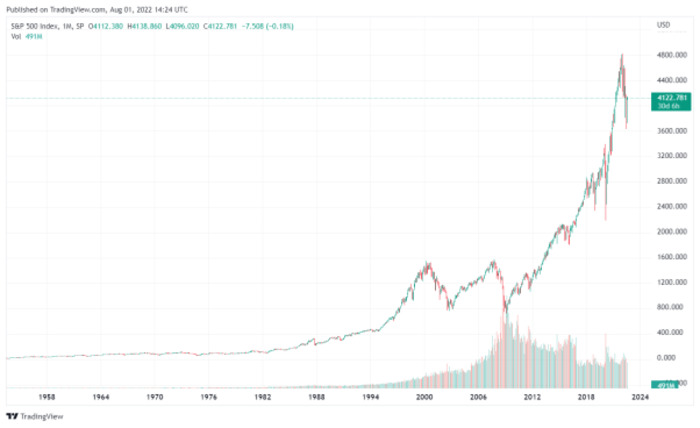
To analyze the trend of U.S. stocks, we usually use the per-share index to analyze. There are four most important indexes in the U.S. stock market: US30, also known as Dow Jones Index (DJ30), US500, S&P 500 (S&P500), Nasdaq 100 index and the Russell 2000 index. Usually we can think that the long-term chart of the price history of the S&P 500 index can be used as an interpretation of investors' sentiment on the US economy, so today we will use the S&P 500, the "wind vane" of the US economy, to analyze the trend of US stocks.
Source: tradingview
The US500 began trading in 1957, and in its first decade, the index rose in value to just above 100, reflecting the post-World War II economic boom. From 1969 to early 1981, the index gradually declined. During this period, the U.S. economy struggled with stagnant growth and high inflation.
Inflationary pressures were successfully eased through Fed rate hikes and intervention. This contributed to the bull market from 1982 to 2000, when stock prices rose and the S&P 500 soared.
In 2000, the stock market went through a bubble. This period was marked by overvalued valuations, excessive public enthusiasm for stocks, and speculation in the tech sector. The US stock market then reached a new peak in 2007, driven by real estate, financial stocks and commodity stocks.
However, with the advent of the 2008-09 financial crisis and the Great Recession, the S&P suffered its biggest drop in history.
By March 2013, the S&P had recovered all its losses from the financial crisis, surpassing the 2007 high and the 2000 tech bubble high.
In 2020, due to the global outbreak of the epidemic, on March 23, 2020, the index had plummeted to 2,237.40, a drop of 34% in just over a month. The trading price of US500 on August 1, 2022 is: 4123.46.
The above are several major events experienced by the US stock market, as well as the historical trend.
Analysis of the U.S. stock market in the first half of 2022
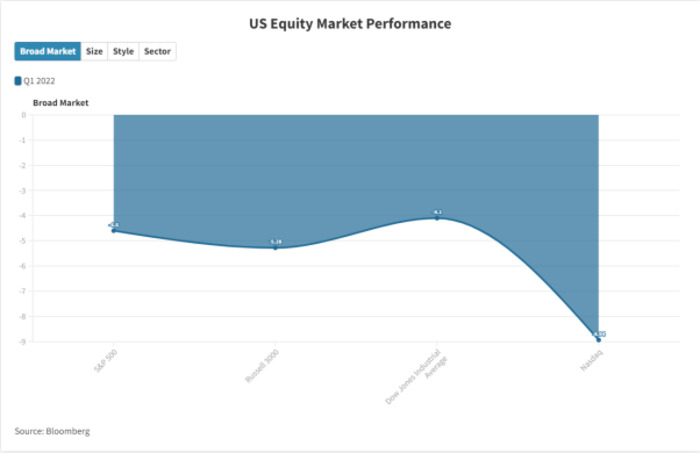
Source: Bloomberg/Flourish
Stocks fell, bonds fell and commodities such as oil, gas and wheat soared due to the chaos in global markets caused by Russia's invasion of Ukraine in late February. While U.S. economic data was otherwise steady, the incursion added to existing concerns about inflationary pressures.
The U.S. stock market still experienced a downward trend in the first quarter, with the S&P 500 down 4.6%, the Russell 3000 down 5.28%, the Dow Jones down 4.1%, and the Nasdaq down 8.94%.
And by the second quarter, due to rising inflation expectations, the Fed tightening monetary policy, the continuation of the Russia/Ukraine war, and the shutdown of China due to the new crown epidemic. The S&P 500 fell -16.1% outright, its biggest quarterly drop since the first quarter of 2020. The S&P 500 is down -20.0% year to date, and a 20% loss at the close means the S&P is in a bear market.
US stock market forecast for the second half of 2022
We admit that there are many uncertainties in the market, such as the Uzbek-Soviet war in the first half of the year, but when evaluating the trend of U.S. stocks in the second half of 2022, we still have one sure thing, that is, the Fed will raise interest rates again. The Fed raising interest rates will undoubtedly stimulate the rise of US stock prices. Just like the US stock market from 1982 to 2000, the interest rate hikes have well controlled inflation and ushered in a bull market.
Economic uncertainty could peak in the first half of 2022, but could still cause volatility and affect market performance for the rest of the year. We believe there will be a new growth momentum in US equities at a time when inflation peaks and aggregate demand and supply are stable.
What affects the U.S. stock market
Generally speaking, we believe that when analyzing the trend of the U.S. stock market, we need to conduct a macro analysis. Below we list the most noteworthy factors affecting the U.S. stock market this year.
Inflation is already at multi-decade highs, economic data is running out of steam, and the Federal Reserve looks to raise interest rates aggressively to stimulate economic dynamism, and the current stance of monetary policy may be the most hawkish the central bank has taken in decades.
The Chinese government is determined to maintain a zero-tolerance policy regarding the epidemic, which undoubtedly increases market uncertainty. China is a major power in the world's supply chain, and China's actions will have a considerable impact on the U.S. stock market.
We generally think of the unemployment rate as a lagging indicator for stocks, and when the unemployment rate shows up and is higher than expected, it can have an impact on the stock market. High unemployment is a sign that people are looking for work, and as unemployment rises, confidence in the economy falls, and stock prices often fall too.
Is now a good time to invest in US stocks?
We believe that from the current form of U.S. stocks, it is easy to get caught up in rushing into the stock market now. So, you might consider investing in contracts for difference (CFDs) on stocks.
Since its inception, CFD trading has grown in popularity as a capital-light trading type, and one of the many benefits of using trading CFDs to invest in stock indices is profiting from both rising and falling markets. Our current recommended CFD trading platform is CM Trade, an award-winning broker.
Below I will give an example to let you understand the inherent trading logic of stock index CFDs.
Suppose you are using 100-to-1 leverage and the S&P 500 is at 1146.25. When you expect the S&P 500 to fall, you can "go short" at 1146.25 and sell 100 contracts, which means you are now buying the S&P 500 with a notional value of $114,625, and $1146.25 is security deposit.
Suppose the next day the S&P 500 drops 10 points, the price is 1136.75, and all your contracts are worth $113,675, the difference between the value at the time of opening and the value at the close is $114,625 to $113,675, equivalent to $950. Add in the interest on the overnight position and you're just over $950 in profit.
The advantage of CFD is that it can make money in both directions. If you are an investment novice, you can subscribe to our website. If you are a veteran with certain experience, you must also try to download our investment software. All the functions will become The sword of your investment.
Summarize
To sum up a little, if you want to understand and analyze the trend of US stocks, the rise and fall of the stock index will be a good reference indicator. For now, direct investment in U.S. stocks is not a good choice, and I think it will be a good experience to invest and trade U.S. stock indexes through CFDs using price fluctuations.


 简体中文
简体中文
 ภาษาไทย
 繁體中文
繁體中文
 Indonesia


 2022-08-03
 4365
4365