


 简体中文
简体中文
 ภาษาไทย
 繁體中文
繁體中文
 Indonesia


Will gold really be in short supply?
 2023-04-26
 1209
1209
Recently, many people have talked a lot about the logic of gold. In addition to the classic logic of "the negative correlation between the price of gold and the real interest rate of the US dollar", the voices of the logic of "tightening the supply of gold" are also increasing recently. This logic was first released from the upstream supplier.
Gold production and proven reserves both declined
Miners who used to focus on precious metals have been diverting funds to battery metals and other mineral resources that meet ESG standards for more than a decade. As the chart below shows, many traditional gold miners have been cutting gold production.
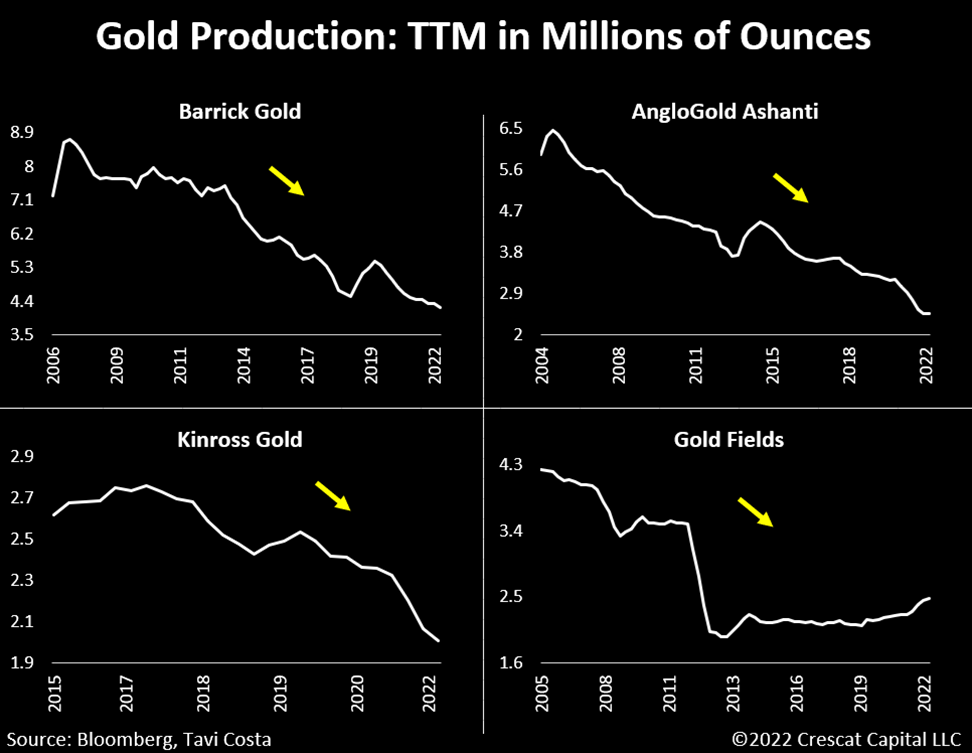
In terms of the scale of proven gold reserves, it is also continuing to decline.
Since 2019, global gold production has continued to decline. Therefore, many people believe that we may be in the early stages of a long-term decline in gold production, and the price of gold is expected to take a rocket.
If the price of gold enters a mid- to long-term upward cycle again, will the increase bring big surprises to investors? To answer this question, we still have to start from the first principle to see what is the rise in the price of gold?
Gold is considered a zero coupon bond
From the perspective of macro analysis, gold, as a common currency in the world, is usually regarded as a zero-coupon U.S. dollar bond, which roughly shows a negative correlation with the real interest rate of the U.S. dollar.
There are two keys to this logic:
1) Gold and U.S. dollars are interchangeable;
2) Gold itself is a physical asset. The cost is viewed globally, and the price is pegged to the US dollar.
Gold production distribution map by country in 2022
The depreciation of the U.S. dollar is equivalent to the appreciation of other currencies, and the cost of gold mining denominated in U.S. dollars will increase, driving the price of gold to rise. Assuming that the nominal interest rate of the US dollar remains unchanged and the rate of inflation rises, it can be seen that the real interest rate of the US dollar will fall and the price of gold will rise.
But when we turn the time back to the second half of 2020-the first half of 2021, we will find that this logic has failed-at that time, the real interest rate of the US dollar fell, and the international gold price also fell.
The analysis becomes a little simpler when you take into account the supply and demand of gold. Again, we start with the World Gold Council data, the table below shows the supply and demand of gold over the past 12 years.
In terms of total supply, in fact, there is not much change every year, which is more than 4,000 tons. After all, project mining also has inertia, and it is impossible to stop and do it as soon as you say it. Our focus is mainly on demand.
The first item in the demand is the sub-item of gold jewelry. China and India are big consumers. It can be clearly seen that in normal years, the demand for gold jewelry is around 2,000 tons; however, due to the impact of the epidemic, the consumption of gold jewelry will be halved in 2020 to only 1,000 tons, which is very important.
The demand in the science and technology sub-item is not very important. One is that the scale is small, about 300 tons per year; the other is that the demand is stable, even in 2020, there has not been much change.
Finally, the investment sub-items that the market pays close attention to: 1) The investment demand for physical gold is stable; 2) The demand for hoarding gold by central mothers is relatively consistent; 3) The market’s investment demand for gold ETFs is full of fluctuations.
When it comes to the surplus, before 2015, the surplus of gold supply and demand basically fluctuated around a value of 0; since 2015, the supply began to greatly exceed the demand, and the surplus has always remained above 300 tons. Even in 2020, the surplus once exceeded 1,000 tons. [The surplus here mainly refers to over-the-counter (OTC) gold. 】
That is to say, due to the halving of gold jewelry consumption demand in 2020, 1,000 tons of gold have not flowed into the open market, and the gold market is in a state of obvious oversupply.
From the perspective of supply chain analysis, the oversupply of gold means that the logic of rising prices on the cost side (downward real interest rates of the U.S. dollar) cannot be transmitted to the price side, and the price of gold will not rise with mining costs, and may even fall.
Analysis of Future Gold Trend
What is the trend of gold in the future? Two questions need to be answered first:
1) Has the spot gold accumulated in the market before been digested?
2) What is the future trend of the real interest rate of the US dollar?
Let's look at the first question first. In 2022, the mothers of various countries began to hoard gold on a large scale, hoarding 11.357 million tons in one year, reducing the gold surplus that year to 13.8 tons.
And in 2023, this trend will continue. According to the data of foreign exchange reserves in February, my country's central government has bought gold for 4 consecutive months, and has bought a total of 102.02 tons of gold.
Considering that in the past 6 years (16-21 years), the average annual surplus in the international gold market has been more than 300 tons. If you want gold to return to a tight balance, the gold must have a deficit in the 23 years. OK.
This piece of data cannot be obtained accurately. Judging from the perspective of technical analysis, the effect may be better. If the international gold price can break through the box from July 2020 to the present, it means that the market is no longer concerned about the oversupply of gold, but is trading the downward trend of the real interest rate of the US dollar.
The second question is what happens to real interest rates in the U.S. dollar.
With regard to the banking crisis represented by Silicon Valley Bank, in order to limit the impact of the U.S. banking thunderstorm, the Federal Reserve is frantically trying to expand its balance sheet to provide liquidity for banks that are being run on. It needs to be clear here that expanding the balance sheet to save the banking industry and suppressing inflation are two conflicting things. In the follow-up, the Fed is likely to fight left and right, raising interest rates while expanding its balance sheet, adding noodles when there is too much water, and adding water when there is too much noodles.
In terms of nominal interest rates, the short-term trend is still upward. Unless the Fed can't hold back in the second half of the year, it must cut interest rates to save the market. And on the inflation front, it still looks resilient for now. In other words, the real interest rate of the US dollar is still likely to rise in a short period of time. If the U.S. economy has a hard landing in the second half of the year, the real interest rate of the U.S. dollar will likely decline.
At present, the price of gold is jointly supported by risk aversion sentiment, the slowdown in the upward expectation of real interest rates, and the decline in the dollar. But as to whether there will be an "explosive rise in gold prices due to tight supply", historically, the highest gold supply deficit is about 200 tons, and the gold stocks accumulated in the past few years can still be digested for a few years.
Gold Technical Analysis
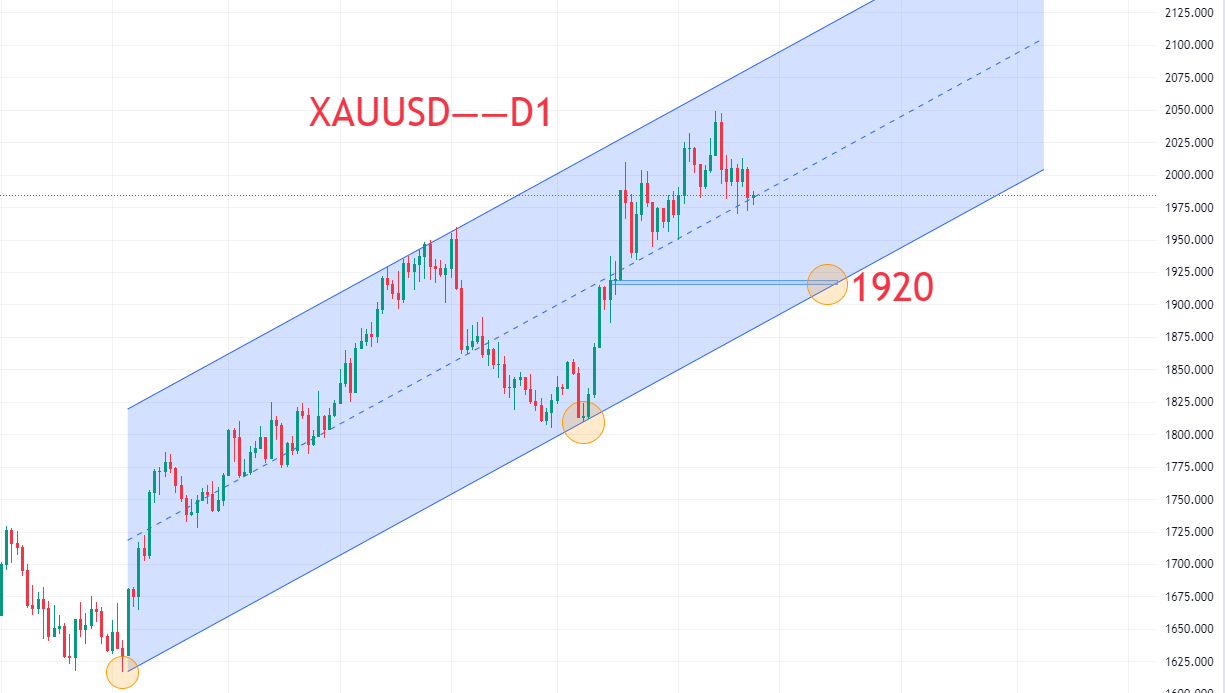
The daily chart shows that since December 2022, gold has been in a choppy upward channel. Benefiting from the anticipation of the Federal Reserve's interest rate cut and the hedging support of the economic recession, the price of gold continued to rise and is still in a bullish structure. The upper resistance is around 2070, and the lower support is at 1960 and 1920 respectively. Since it is almost only a matter of time before the Fed cuts interest rates, the gold bull market is not over, and buying on dips in May is still the main theme. Investors need to allocate their positions well, and wait patiently for the opportunity of multi-order layout after the callback. The main echelon of positions is matched, the stop loss can be placed around 1880, and the target is 2070~2200.
The above information is provided by special analysts and is for reference only. CM Trade does not guarantee the accuracy, timeliness and completeness of the information content, so you should not place too much reliance on the information provided. CM Trade is not a company that provides financial advice, and only provides services of the nature of execution of orders. Readers are advised to seek relevant investment advice on their own. Please see our full disclaimer.
CM Trade
As a world leading financial trading platform, CMtrade Provides comprehensive one-stop trading services and opportunities for traders.
[Products]
The platform provides over 32 kinds of popular financial products such as forex, precious metals, crude oil, indices, cryptocurrencies and more.
[System]
2 top trading systems CM Trade MT4 / CM Trade APP, powerful and easy to operate
[Service]
Comprehensive market news, professional market analysis, 7*24 hours online customer service
[Advantage]
Low cost, high leverage, flexible one-stop all day two-way trading.
[Authority]
Licensed and strictly regulated by authorities. Traders deposits are independently kept by the bank. Fast deposit and withdrawal. Fair, efficient and transparent trading environment.
Follow us to learn more


CM Trade Mobile Application
Economics Calendar
MoreYou May Also Like


