Market analysis on December 22
 2022-12-22
 1193
1193
gold
On Wednesday (December 21) market volatility was flat as Christmas holidays approached. U.S. economic data was mixed. The U.S. dollar index stopped falling for two consecutive days and regained the 104 mark, closing up 0.25%. Pass gravity, and finally closed down slightly by 0.18%. On the one hand, the Federal Reserve still maintains a tough hawkish attitude, but according to the latest survey of economists, the probability of a recession in the U.S. economy next year will reach 70%. As recession fears intensify, as risk appetite continues to recover, it may bring the safe-haven dollar a boost. To negative impact, thus providing further upward momentum for gold prices.
In addition, another reason for the recent rise in gold prices is the Japanese yen. The surge in the Japanese yen disrupted the rhythm of market fluctuations before the holiday and caught the US index off guard. Whether the gold price can continue to rise in the later period also needs to pay attention to the trend of the Japanese yen.
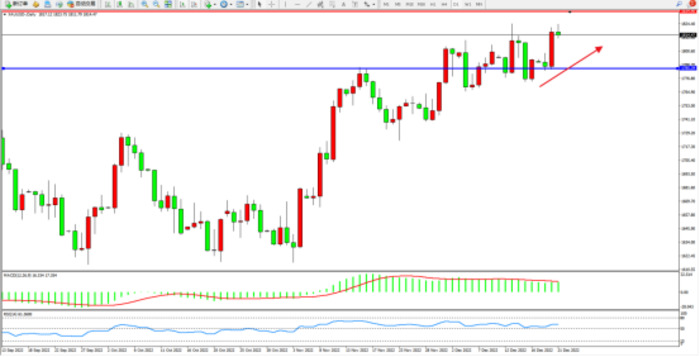
Gold - daily K-line display:
The high-level bullish momentum continues to fluctuate and rise, and short-term bullish sentiment emerges. The upper suppression focuses on around 1834, and the low-level support focuses on around 1785;
The MACD indicator is in the long zone;
The RSI indicator is hovering above the 50 balance line;
As shown in the picture:
crude
The Saudi Energy Minister said on Tuesday (December 20) that OPEC+ must remain proactive and pre-emptive, and that it would not be surprising if crude oil shortages reappeared in early 2023. The Saudi oil minister reminded oil market participants that OPEC+ can and will continue to make decisions based on its perception of market conditions and can adjust accordingly. In addition, the latest EIA data showed that U.S. crude oil inventories fell by 5.89 million barrels, which was estimated to decrease by 1.66 million barrels. Price Futures analyst Phil Flynn said the report was very bullish, especially as crude oil inventories fell and distillate inventories stopped rising in a row before the cold snap hit.
To sum up, Saudi Arabia's speech and the sharp drop in EIA inventories are positive for overnight oil prices. U.S. crude oil broke through $78/barrel and closed up 3.19%, marking the third consecutive day of gains.
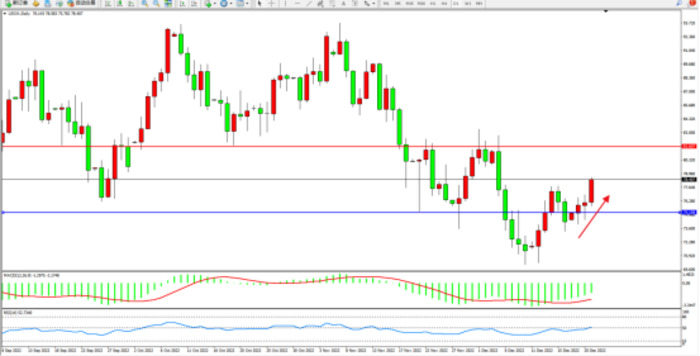
Crude oil - daily K-line chart shows:
The low-level bulls have a strong upward momentum, short-term bullish sentiment emerges, and the market’s bullish momentum continues to rise. The upper-side suppression focuses on around 81.607, and the low-level support focuses on around 75.158;
The MACD indicator is in the short area and moves up;
The RSI indicator is in a weak position near the 50 balance line;
As shown in the picture:
European and American
The euro held steady against the dollar on Wednesday as the greenback rallied after Germany's GfK consumer confidence index for January topped expectations, signaling a brighter outlook for the third time in a row. In addition to the weakening of the U.S. index, the support for the recent high exchange rate of the euro mainly comes from the hawkish stance of the European Central Bank. The central bank is committed to reducing inflationary pressure in the euro zone and frequently sends out hawkish signals.
The market direction for a range of dollar pairs will be determined by U.S. economic data on Friday ahead of the Christmas holidays, with a final bout of volatility likely on Friday, when the latest U.S. inflation data, core personal consumption expenditures (PCE) and Michigan The university consumer confidence report may cause large fluctuations in the euro before the holiday.
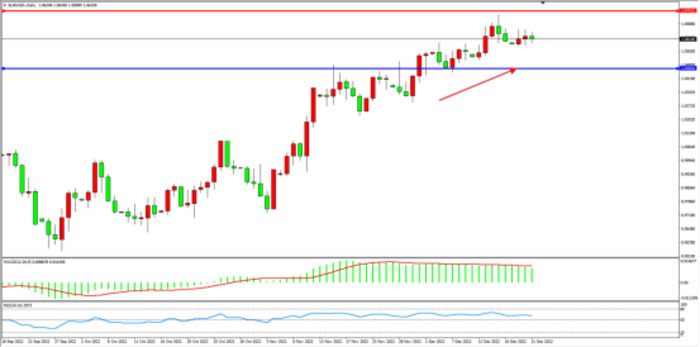
Europe and the United States - Japan K-line display:
The bullish momentum continues to rise, short-term bullish sentiment emerges, but the high level begins to hover slowly, the upper suppression focuses on around 1.07522, and the low support focuses on around 1.04604;
The MACD indicator is in the bullish area and is moving;
The RSI indicator is hovering weakly above the 50 balance line;
As shown in the picture:
Pound US
The recent trend of the British pound is obviously weaker than that of the euro, mainly because the Bank of England has been following the Fed's tightening path, and has a sudden positive expectation for the market, while the European Central Bank has been relatively dovish, and the sudden release of hawkish signals has led to buying Significant surge. Looking ahead, before the Christmas holiday, the economic data of the United States on Friday will determine the market direction of a series of dollar currency pairs. There may be a final round of volatility on Friday, when the United States will announce the latest inflation data, core personal consumption expenditure ( PCE) and the University of Michigan's consumer confidence report may cause large fluctuations in the pound before the holiday.
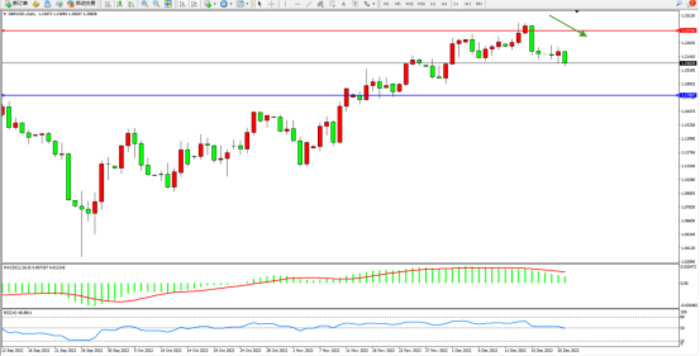
Pound US - the daily line shows:
The high-level short-term momentum has turned downward, and the market’s short-term sentiment has already emerged. The short-term decline may continue. The upper suppression focuses on around 1.23716, and the low-level support focuses on around 1.17887;
MACD indicator
RSI indicator
As shown in the picture:
America and Japan
As the market failed to respond to the rapid "turn" of the Fed's monetary policy, the Bank of Japan adjusted the yield curve control (YCC) on Tuesday (December 20), and the 10-year government bond yield target range was expanded from plus or minus 0.25% to plus or minus 0.5%. However, the market interpreted this move as a signal that the Bank of Japan is about to end its easing, and it is better than raising interest rates instead of raising interest rates. In particular, Japanese funds are big buyers of European and American bonds. The Bank of Japan’s regulation is equivalent to raising the financing cost of Japanese funds, which may trigger Japanese funds to liquidate their positions in European and American bonds, and a large amount of funds flow back to Japan. Pre-Market Fluctuation Rhythm
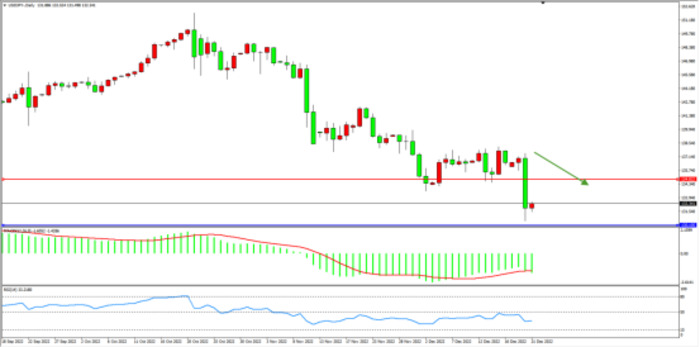
Looking ahead, with the Bank of Japan’s major policy shift, the trend of USD/JPY is likely to be mainly down in the near future
United States and Japan - the daily line shows:
The short-term momentum fell sharply at the low level, and the short-term decline may continue. The upper suppression focuses on around 134.822, and the low support focuses on around 130.105;
The MACD indicator is in the short zone;
The RSI indicator fluctuates within a narrow range in the bear area;
As shown in the picture:
Dow
Last night, the three major U.S. stock indexes rose by more than 1%. After experiencing the indecision of the previous trading day, U.S. stocks started a wave of strong rebound
In the end, the Dow rose 1.60%, the Nasdaq rose 1.54%, and the S&P rose 1.48%. The U.S. economic data overnight was mixed, but the U.S. Conference Board consumer confidence index for December recorded 108.3, a new high since April 2022. The recovery of consumer confidence boosted the market, and U.S. stocks finally opened higher and closed higher.
Looking ahead, considering that the Federal Reserve will remain hawkish next year and inflation will remain too high, there is a possibility that US stocks will be bearish. The rebound at the end of the year may not last for too long.
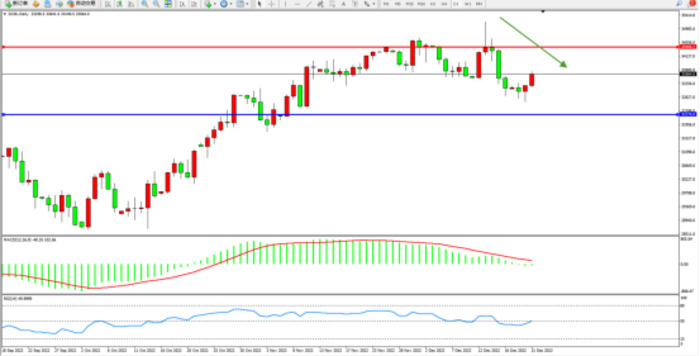
Dow - daily line shows:
The high-level short-term power ladder fluctuates downward, and there are signs of recovery in the short term, but the overall trend is in a downward trend. For upper suppression, pay attention to around 34406, and for low support, focus on around 32276;
The MACD indicator is hovering weakly near the 0 axis;
The RSI indicator is in the short area and moved up to the weak order near the 50 balance line;
As shown in the picture:
The above information is provided by special analysts and is for reference only. CM Trade does not guarantee the accuracy, timeliness and completeness of the information content, so you should not place too much reliance on the information provided. CM Trade is not a company that provides financial advice, and only provides services of the nature of execution of orders. Readers are advised to seek relevant investment advice on their own. Please see our full disclaimer.

CM Trade
As a world leading financial trading platform, CMtrade Provides comprehensive one-stop trading services and opportunities for traders.
[Products]
The platform provides over 32 kinds of popular financial products such as forex, precious metals, crude oil, indices, cryptocurrencies and more.
[System]
2 top trading systems CM Trade MT4 / CM Trade APP, powerful and easy to operate
[Service]
Comprehensive market news, professional market analysis, 7*24 hours online customer service
[Advantage]
Low cost, high leverage, flexible one-stop all day two-way trading.
[Authority]
Licensed and strictly regulated by authorities. Traders deposits are independently kept by the bank. Fast deposit and withdrawal. Fair, efficient and transparent trading environment.
CM Trade Mobile Application
Economics Calendar
MoreYou May Also Like


 简体中文
简体中文
 ภาษาไทย
 繁體中文
繁體中文
 Indonesia


